
Listening to Cities: Insights from the 2025 City Experiment Fund Cohort
How do cities understand the needs of their citizens – and turn those insights into meaningful action? As part of the 2025 cycle of the City […]


Andrii Nahornyi is a GIS specialist with a background in spatial data analysis, cartography, and remote sensing. He holds a BSc in Geomatics and specializes in data visualization and geospatial interpretation. Andrii enjoys turning complex geospatial data into meaningful insights and visual stories that support real-world decisions.
This year, I had the incredible opportunity to volunteer at the City Experiment Fund – a regional UNDP initiative, collaborating with cities in Europe and Central Asia to drive sustainable urban transformation through strategic innovation. This experience left a lasting mark on both my professional journey and personal growth. Over a few months, I contributed to a GIS-centered initiative aimed at supporting sustainable urban development in various cities in the region, and I’d like to share a few reflections on the process, the challenges, and the progress we made together. Read the full CEF Exploratory GIS Analysis here.
My collaboration with the Innovation team began by designing a strategic plan focused on the geospatial component of the project. As the GIS Specialist on the team, my first task was to research each city involved in the project. I delved into their histories, geographic features, and socio-economic contexts to gain a deeper understanding of the forces shaping urban development. Once the groundwork was laid, I began sourcing data—vector, raster, and statistical—while organizing everything in a way that would support efficient geospatial analysis. This step was more than just data management; it was about building a foundation for meaningful insights. I quickly learned that even the most advanced tools are only as useful as the data behind them. Accuracy, relevance, and consistency became my guiding principles.
The heart of my work was the geospatial analysis phase, which required careful selection of analytical methods supported by academic literature and technical expertise. Using both Esri ArcGIS and QGIS, I examined everything from land use and elevation to traffic patterns and wildfire exposure. The final and most rewarding phase was visualizing these insights through maps, turning raw data into accessible, visually compelling tools that could inform real-world decisions. In total, we created over 50 detailed maps, accompanied by a comprehensive report explaining our methodology, findings, and recommendations.
However, the journey was not without its hurdles. The greatest challenge was sourcing reliable, up-to-date, and publicly available geospatial data. GIS analysis is only as strong as the data it relies on, and ensuring objectivity and accuracy meant long hours combing through local databases, translating government records, and verifying open-access datasets. To meet the goal of cross-city consistency, I prioritized global platforms like OpenStreetMap, OCHA, ESA, NASA, USGS, and others. Sometimes I had to cross-reference multiple datasets just to ensure accuracy, especially when there were gaps or inconsistencies.
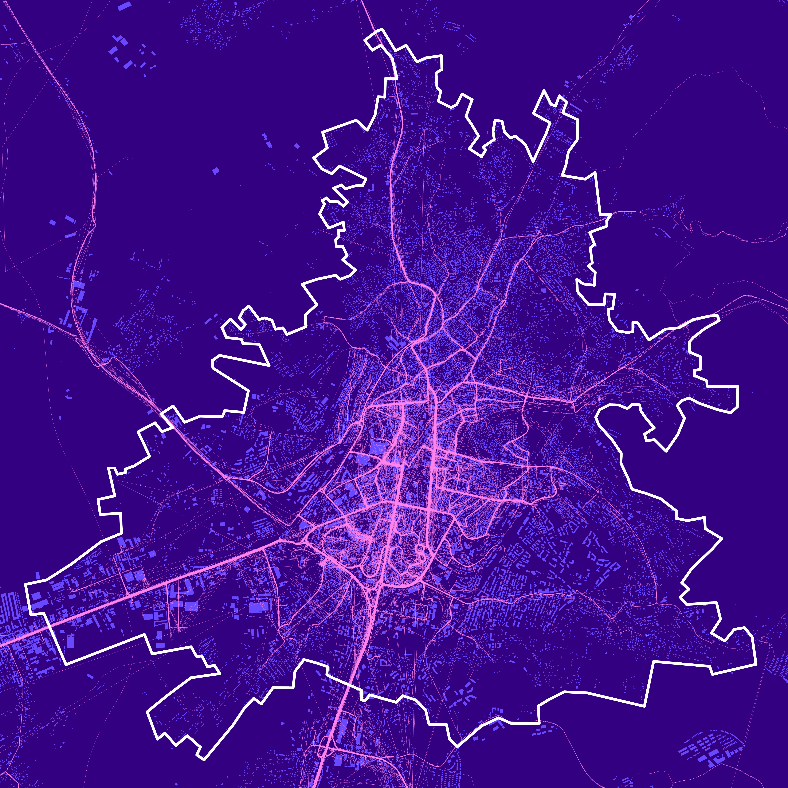
One of my favorite outputs was the Movement Patterns Map of Pristina, Kosovo. Due to a lack of comparable data from other cities, this map stood out. It vividly captured how people navigate the capital, with contrasting lines revealing traffic flow, activity zones, and urban hotspots. This map provides an excellent basis for further analysis and decision-making, such as the development of public transportation in areas of heavy traffic congestion or the development of new businesses in areas of high activity.
I’d also like to highlight two comparative maps that visualize urbanization trends in Pristina, the capital of Kosovo[1], and Podgorica, the capital of Montenegro. I chose these two maps for comparison because they show the diversity and contrast of the cities I have worked with. Pristina shows a dramatic surge in development around the year 2000, with a rapid expansion forming new peripheral neighborhoods. In contrast, Podgorica reveals a more gradual, radial growth pattern spanning three decades. These maps don’t just show land use—they tell the story of two very different urban evolutions.

The cities we worked with—Gostivar, Tashir, Kovel, Pristina, Nizhyn, Pljevlja, Obiliq, Kavadarci, Podgorica, and Stepanavan—may differ in size, location, and background, but they all share one thing: immense potential. In every dataset and on every map, I saw evidence of resilience, growth, and opportunity.
This project reminded me that volunteering is not just about giving time—it’s about growing together, learning from each other, and building tools for change. I look forward to seeing how these cities grow—and I hope our paths cross again in the future.
RELATED POSTS
How do cities understand the needs of their citizens – and turn those insights into meaningful action? As part of the 2025 cycle of the City […]
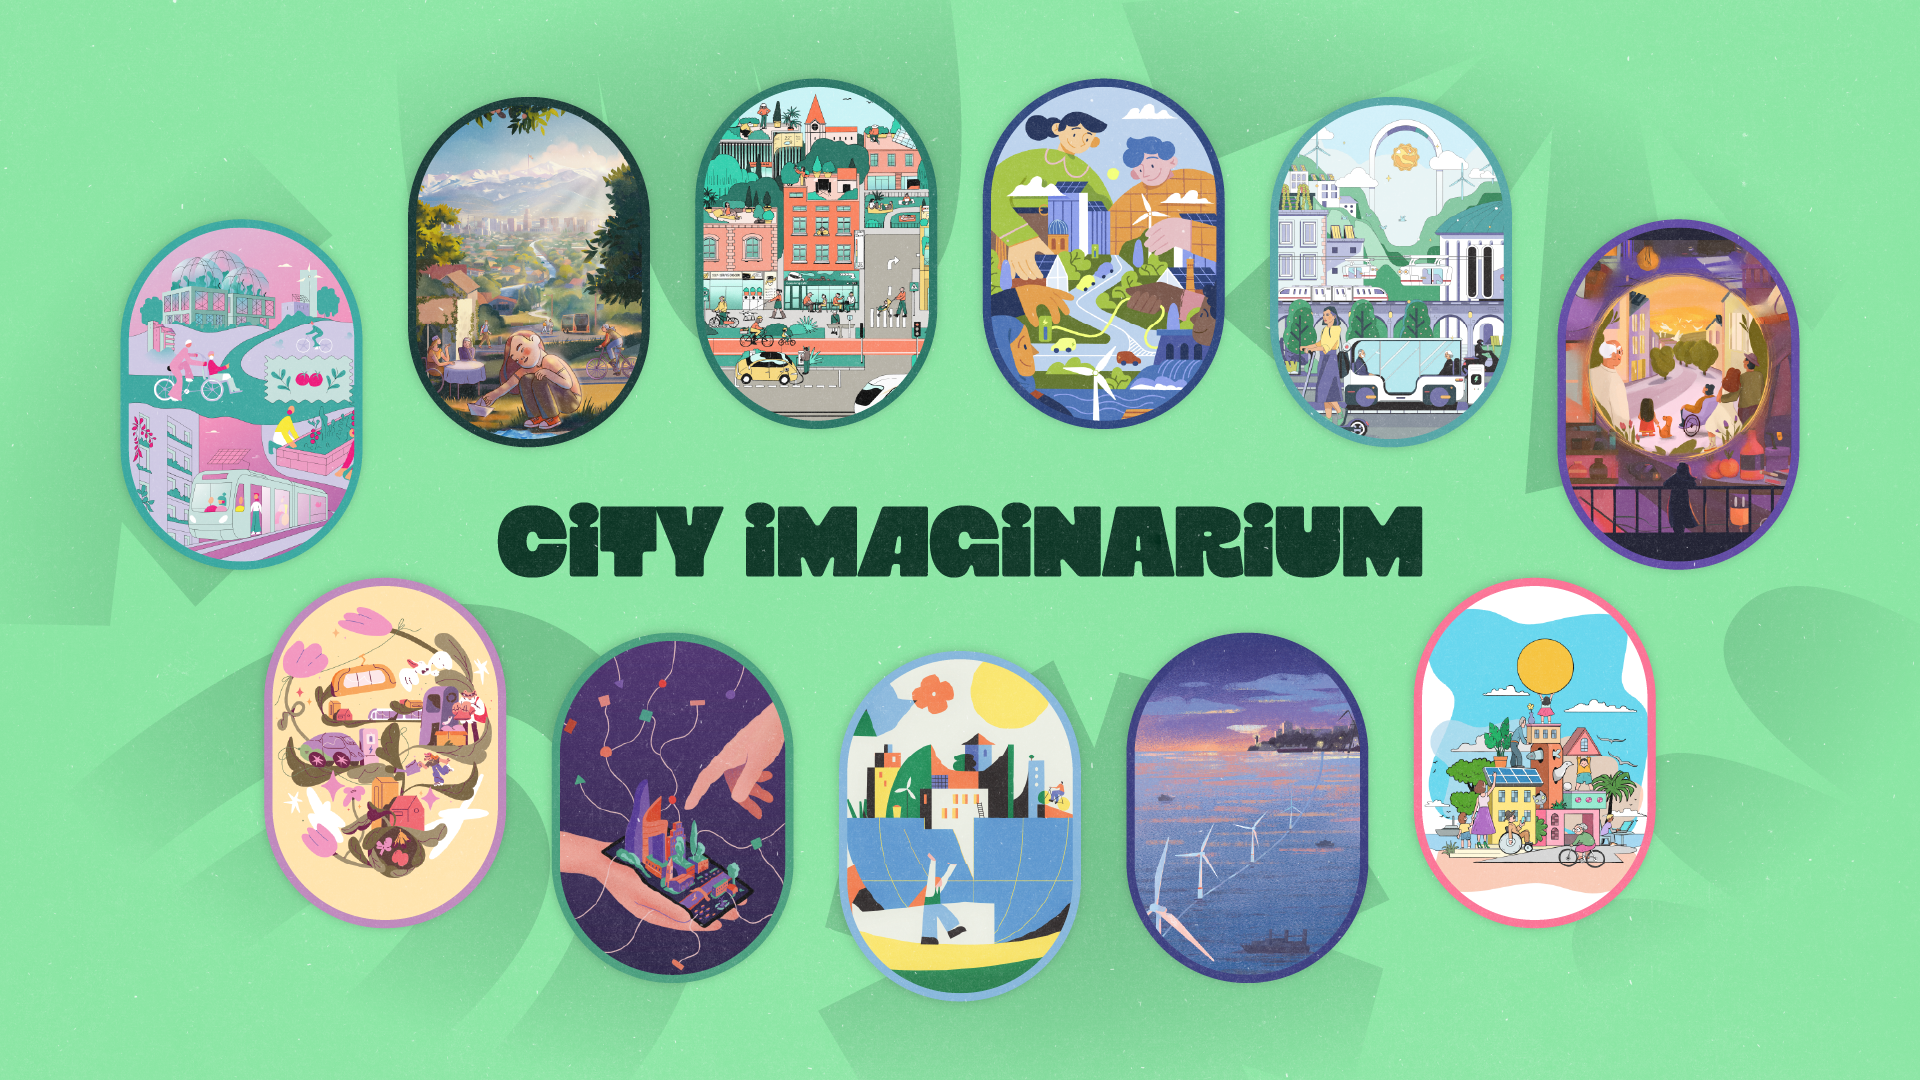
On World Cities Day 2025, UNDP in Europe and Central Asia launches the City Imaginarium — a regional creative campaign that invites artists and communities […]

UNDP Armenia is in the process of starting a partnership with Plastiks to address the country’s underdeveloped recycling infrastructure by piloting a blockchain-based model that […]